How To Guides
Modelling a dart player with bivariate distributions
With our sampling techniques you can model a dart player with a distributed probability of hitting certain areas.
In this guide we will model a very good dart player so will have a more accurate horizontal aim but a less accurate vertical aim, such as in real life. To model our samples on a graph we will be using matplotlib so we will need to import it
>>> import matplotlib.pyplot as plt
We will be using a normal distribution to model our dart players accuracy as accuracy normally follows a normal distribution, it is also very easy to change a normal distribution to add more spread and change the mean
>>> dart_player_horizontal = Beans.NormalDistribution(0, 0.1)
>>> dart_player_vertical = Beans.NormalDistribution(2, 4)
We will now take our samples and add them to tuples to use as our x_values and y_values. We will be using an x_seed and y_seed so you can reproduce the results yourself
>>> number_of_darts = 50
>>> x_seed = 1
>>> y_seed = 2
>>> x_values = dart_player_horizontal.TakeMultipleSamples(number_of_darts, x_seed)
>>> y_values = dart_player_vertical.TakeMultipleSamples(number_of_darts, y_seed)
Now we will customize our plot to make it readable and add our dartboard in the centre
>>> figure, axes = plt.subplots() #Generates our blank graph
>>> draw_dartboard = plt.Circle((0,0), 5, fill=False) #Adds our dartboard
>>> plt.xlim([-9, 9]) #Sets our x axis
>>> plt.ylim([-9, 9]) #Sets our y axis
>>> axes.set_aspect(1) #Keeps the plot in a 1:1 ratio
>>> axes.add_artist(draw_dartboard) #Adds our dartboard to the plot
>>> plt.show() #Shows the plot
As you can see we have an empty dart board nice and centred in our plot that has kept its aspect ratio

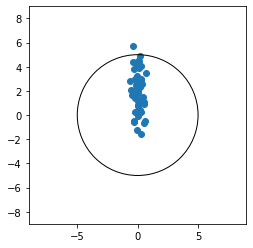
Now we will add our darts to the board by adding in our darts before we show the plot
>>> figure, axes = plt.subplots() #Generates our blank graph
>>> draw_dartboard = plt.Circle((0,0), 5, fill=False) #Adds our dartboard
>>> plt.xlim([-9, 9]) #Sets our x axis
>>> plt.ylim([-9, 9]) #Sets our y axis
>>> axes.set_aspect(1) #Keeps the plot in a 1:1 ratio
>>> axes.add_artist(draw_dartboard) #Adds our dartboard to the plot
>>> darts = plt.scatter(x_values, y_values) #Adds our darts to the plot
>>> plt.show() #Shows the plot
As you can see our dart player went for the triple 20, and was fairly consistent at getting it at the correct horizontal place but strugged with the verticallity